The 'fractal' medical record

Medical data are complex and heterogeneous with individual patient records combining multiple disparate sources of information including :
- administrative data, scheduling and context (e.g. outpatient neurology clinic - movement disorders)
- patient reported outcome and experience measures (e.g. “I can walk”, “he was rude”)
- clinical diagnostic, procedural and outcome measures (e.g. “multiple sclerosis”)
- diagnostic synthesis and management plans (e.g. “offer a new high-risk disease modifying treatment”)
Between those categories, it is possible that we can answer the what, who, how and possibly the why.
What many people don’t realise is that the interpretation of medical data, irrespective of its form, depends, to a variable degree on everything else. The most important dependency, in my view, is the context in which those data were acquired. This need for interpretation is why the phrase, “the single source of truth”, when used in building health record software, is only a partially useful mantra; it hopefully encourages a data-focused, clinical modelling approach but it inappropriately suggests that there is a “single truth”.
So you need to re-appraise how you consider, for example, “problem lists” - and understand that the meaning of “angina”, whether encoded as a consecutive array of letters of the alphabet (e.g. in English: “a-n-g-i-n-a” as free text) or encoded using a code from a medical terminology or classification system (e.g. in SNOMED-CT: Angina (disorder) SCTID: 194828000 with synonyms: Angina, Cardiac angina, Angina pectoris, Stenocardia, Anginal syndrome, AP - Angina pectoris, Ischemic heart disease - angina, Ischaemic heart disease - angina, Angina (disorder)) cannot be understood without contextual information, including the series of logical inferences that resulted in that diagnosis.
In particular, you should regard a diagnosis of “angina” with skepticism if it was given by me, a consultant neurologist but you might trust my diagnosis of “myasthenia gravis” even if the antibody test for that condition is negative.
Even data sourced from an accredited laboratory requires careful interpretation. A single test might be a false-negative result unless there is 100% sensitivity. Likewise, a positive test may be false-positive unless there is 100% specificity; either scenario would be extremely unusual indeed. In addition, tests, such as laboratory tests may be combined to improve their predictive power. It becomes even more complex as sensitivity and specificity depends on the a priori probability of that test in that population. As a result the interpretation of a test or combination of tests depends on the context in which those tests were performed. A positive test result performed as the result of screening a whole unselected population has less importance than a test performed in a patient suspected of having the disease in question.
So if a laboratory test does not perfectly predict a disease, we can easily see how more subjective, opinion-based tests and diagnostic processes such as radiology or getting a clinical opinion in an outpatient clinic, will suffer from the same issues. In particular, if a report changes (and they do) or clinical opinions vary (fairly common) then “truth” becomes a poor conceptual foundation for our electronic health systems.
The logical conclusion is that there is no single “truth”, but instead a deeply hierarchical, nested inter-dependent, frequently correlated set of multi-dimensional data. Does it matter?
Data for decision-making
I’ve written about measurement previously concluding that medical data, whether a measurement of a physiological parameter, a laboratory test result or report from a radiological investigation, is useful only in reducing the uncertainty around a decision.
As such, we perform measurements, of whatever type, to support decision making and conceptually, those decisions may be grouped into three broad categories:
- the direct care of that patient
- the care of groups of patients within our clinical service(s) and organisations
- clinical research
If we have measurements that don’t influence current or future decisions in any of these domains, then we must ask ourselves why are we performing and recording those measurements at all?
Similarly, if we have imperfect measurements that are not 100% sensitive or 100% specific, then we have to ask, sensitive and specific to what? Realising this provides an important insight: when applied, say to clinical diagnosis, is that almost all of our measurements in medicine are as if we are looking at the truth out of the corner of our eye. We cannot see the hidden truth but a combination of our measurements are, together, governed by a few simpler variables or concepts that are actually the cause of the results of the measurements that we can measure. As a result, we hope that our measurements can be used to understand the latent variable(s) that are actually the hidden cause of those measurements.
For example, sometimes we get an elevated C-reactive protein (CRP) result. It is usually raised in certain types of inflammatory or infectious disorders. It is like the smoke from a fire in a forest, we see the smoke from our helicopter but do not necessarily the cause of the fire. If the patient has had a cough for three days and has a fever, and when we listen to the chest there are crepitations in the right lower zone and the CRP is raised, the diagnosis is likely to be a community-acquired pneumonia. We have to take into account the a priori probability as well, which means that we consider common causes more frequently than rare causes. Likewise, if the patient has had a cough for three months then we might reach a different conclusion.
As such, when we consider clinical diagnosis, our combination of multi-dimensional measurements is providing us with a probabilistic determination of a specific considered diagnosis. Over time and with experience, most clinicians build up a set of heuristics that imperfectly approximate this diagnostic process and learn a range of practical short-cuts in order to cope.
It has always been a surprise to me that we have not yet developed tools to support this fundamentally complex and difficult problem; while we teach “red flags” to aid the identification of the unusual patient (e.g. a headache that is the worst ever headache), such decision-support aids remain crude.
Nested data
When we know a patient has a history of angina and presents with chest pain, understanding how and why that label of “angina” was given is important. In fact, what does that label actually mean? Is it the diagnosis given by a consultant cardiologist or, inappropriately by a rather over-enthusiastic neurologist?
We’re actually using the term “angina” to represent an approximate and subjective clinical concept as an abbreviation rather than endlessly writing down the multiple logical inferences made in order to determine that the patient suffered, for example, chest pain on exertion and had a stent placed for stenosis in her coronary circulation. It is a placeholder that actually hides a lot of potential complexity and permits professionals and patients to communicate and make decisions.
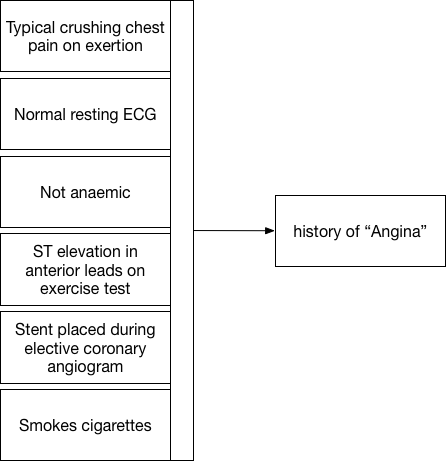
Here we see that a constellation of information (our measurements, binary choices or continuous variables) allows us to apply a pragmatic diagnostic label, “angina”.
Except is that right? What is the point of that label unless it too is useful for future decision making? If I visit the catheter laboratory and ask my cardiology colleague for a coronary angiogram because a patient has “angina”, they’ll want to interrogate that diagnostic label in much greater detail to make a decision about whether a patient should have a specific intervention. They will want to know more than simply “angina”!
Our measurements and our labels are therefore interpretable and usable only in a specific context and for a specific set of circumstances in order to make a decision to effect care. Indeed, for future care, perhaps the diagnosis of “angina” is less useful than an understanding of pathology : ie whether the patient has significant arteriosclerotic vascular disease or not; after all, perhaps that is the biggest predictor of future cardiac events?
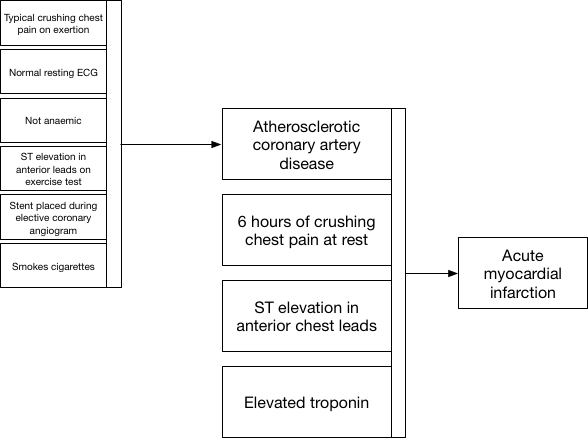
Here we see how we use information when a patient presents to the emergency department with new crushing chest pain. Clinical decisions at the front door can simply use our placeholder diagnostic lists in order to action safe care and combine that historic information (that the patient has proven coronary artery disease) together with new information to make a diagnosis of acute myocardial infarction.
Fractal data

So now we see a repeated pattern in our data used for clinical decision making. Not only is our information nested, but we see that there are similarities in our data at different levels of detail. This repeating pattern of data at different levels of our decision making hierarchy is similar to that seen in fractal data. In essence, a combination of measurements (data) are used to identify a hidden (latent) trait that itself is difficult to measure to inform a clinical reasoning process. The end-result of that clinical reasoning may be itself used in future clinical reasoning. This highlights the naturally recursive nature of medical information.
Importantly, an understanding of the hierarchical nature of clinical decision making allows us to consider the considerable redundancy and correlations seen between different covariates; for instance both having a drug-eluting coronary stent placed in 2014 and a diagnosis of unstable angina both flag an underlying (more difficult to measure) latent trait, namely that of arteriosclerotic coronary artery disease. Those characteristics are therefore highly correlated and may be redundant in a single patient.
Decision making - by humans and by machines
Redundancy and latent traits are important when we consider what information needs to be made available at the time of a clinical decision. How do we make sense of large volumes of hierarchical, highly correlated fractal-type data and decide what needs to be seen by a clinician in a particular clinical scenario, or indeed what needs to be used by a machine to learn to appropriately make a diagnosis or decide on a treatment plan? We cannot show or indeed use all information, and not all information is in fact useful at any particular clinical context. As such, we should be considering techniques to reduce the redundant dimensions that exist within healthcare data. For data mining and “big data” processing, we should be exploring dimensionality reduction techniques in order to make sense of an overload of redundant medical information.
Importantly, we need clinical systems to appropriately model the clinical decision making process and understand that there is no single “truth” but a chain of clinical reasoning at a given point in time that should take into account any and all variables that influence the results of a clinical decision.
Similarly, this is where machine learning and more general purpose artificial intelligence can most help us in our day-to-day clinical work. We need tools to help us understand what our measurements, our data, actually mean and how, in combination, they hide latent variables that should truly determine our next clinical decision. Our knowledge of this fractal-type pattern of clinical decision making should inform how we can generate training data for machine learning and apply those algorithms in the real-world. We should be aiming to replace our informal human heuristics, those short-cuts we use to permit decision-making at a time of significant uncertainty and instead build a data-driven approach to clinical reasoning.
We now have access to sufficient computing power to allow machine supported clinical decision making but those algorithms need to be trained. As such, we must study and understand clinical decision making, adequately model both clinical data and clinical reasoning and make those data available for machine learning so we can build the next generation of tools to improve medical care for all of us.
Mark
Notes:
-
The term “fractal” was coined by Mandelbrot who “based it on the Latin frāctus meaning ‘broken’ or ‘fractured’, and used it to extend the concept of theoretical fractional dimensions to geometric patterns in nature.” I’ve therefore titled this blog post “the broken medical record” for two different reasons: 1) medical records are broken and fragmented in the truest sense of those words, 2) they have similarities to fractal data as they are deeply hierarchical and nested with clinical reasoning built upon chains of previous reasoning (e.g. a process of clinical reasoning takes place in order to order an investigation, the radiologist reporting the scan performs her own reasoning based on the referral and the actual imaging, a receiving clinician repeats the process now integrating all of those chains of reasoning).
-
(Mandelbrot generated by Michael James Dean - Own work, CC BY-SA 3.0, Link)