Applying artificial intelligence in healthcare
In this post, I discuss machine learning and computer-aided decision support in healthcare.
Firstly, I discuss the importance of understanding the process of clinical decision making and how we use information to support that process.
Secondly, I discuss how software can valuably support our clinical decision making.
Finally, I would like to convince you of the need for an computable data structure which I have termed OCMR, the “open computable medical record”.
We, as a community, must collaborate to define the structure of the OCMR. This structure must allow us to create large amounts of publicly-available training data to provide to machine learning algorithms. Likewise, when it comes to evaluation and use of that trained algorithm, we need a computable data structure that can be populated from the real records of an individual patient.
Applying artificial intelligence in healthcare
Artificial intelligence is a term used to describe intelligent machines that makes inferences or decisions based on data with little or no human interaction. Such decisions might be simple and rule-based (“Does this patient have anaemia?”) or more complex inferences based on multiple variables.
Statistical modelling, in which we study an outcome and the covariates that contribute to that outcome is, in itself, not that different to machine learning, at least conceptually; they are akin to two sides of the same coin. The advent of powerful computing power in every desktop and even in your pocket has meant that computationally-intensive methods, such as machine learning, are a useful tool in any statistician’s armamentarium.
Historically, we could create a tool, such as a “CHADSVASC”, that could calculate the risk of a patient having a stroke if they had atrial fibrillation. That tool was generated from a conventional statistical approach looking at thousands of patients, their outcomes and the possible determinants of that outcome; the statistical model would identify the important factors that influence the outcome and provide a coefficient for each factor giving an indication as to its influence. The tool, created based on an understanding of those factors and their influence, can then be evaluated in clinical practice to ensure it is safe and accurate; such analyses might include estimates of sensitivity and specificity in specific populations of patients. For example, a tool generated from data from a non-representative sample of patients is unlikely to be generalisable to other populations. If such a tool is proven valid for a population of patients, then it could be used in clinical practice to support clinical decision making.
Machine learning approaches the problem from a different perspective using a computationally-intensive approach, often from data with many more variables than one could plan to use in a more conventional statistical approach such as logistic regression, to predict results from data. However, the end result is that machine learning can be used to understand data in a broadly similar way to more conventional statistical approaches.
Deep learning is a type of machine learning that has seen rapid advances in the last decade; it is a technology that has been used in computer vision applications to recognise handwriting or categorise images based on the objects or things they contain. However, there are increasing applications outside of this field such as voice recognition, natural language processing and playing common computer and board games to a standard greater than that possible by humans, sooner than expected simply by virtue of advances in raw computing power.
Deep learning uses multiple layers of neural networks to extract, transform and process information in multiple steps, with each layer using the output from the previous layer as input and training performed by backpropagation using a type of gradient descent. This backpropagation is akin to maximum likelihood estimation (MLE) in statistical regression in which estimates of parameters are generated; backpropagation works to train the network to give the outputs as labelled in the training data.
Chains of inference
We already use multiple structured models in clinical practice - such as CHADSVASC or identifying acute kidney injury - as part of the wider care of patients to support a range of purposes such as clinical decision support.
Such models can be considered, generically, as a black-box that when provided with inputs is expected to give an answer:
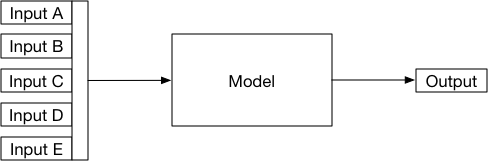
Indeed, such a model does not only apply to proven tools or computer-based decision making but is also applicable to human decision-makers. In the “Fractal medical record”, I discussed the concept of nested hierarchical data being used to make inferences which themselves are used as inputs to support further inferences:
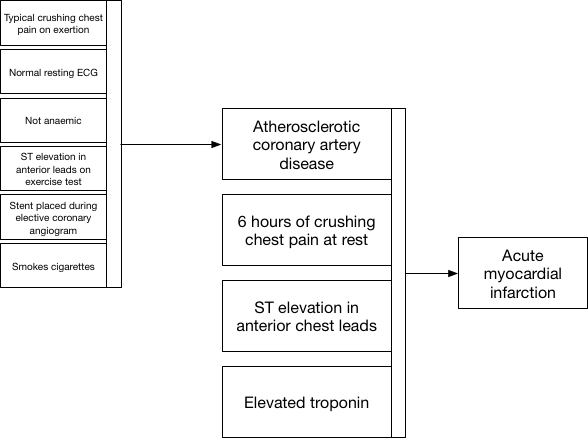
Here the patient reports a crushing tight chest pain when they exert themselves walking up a hill, investigations show a normal resting electrocardiogram (ECG) and a history of smoking, together with some other findings. A diagnosis of angina is made; a useful diagnostic label to aid communication and, importantly, to aid clinical decision making and pattern recognition. When the patient presents in the future with new chest pain and ST segment elevation in the anterior leads of an ECG, old and new factors are combined implicitly to derive two conceptual diagnoses: one is the latent trait of arteriosclerotic disease, perhaps never recorded but concluded implicitly, and one is a new acute anterior myocardial infarction.
Similarly, a consultant radiologist will be given a brief summary of a patient’s clinical problems (“shortness of breath”, “wheeze”), the contextual clues (inpatient vs. outpatient, name of the referrer) and the imaging itself to provide a diagnostic opinion. A respiratory physician may take those same clinical problems, the radiology report and additional investigation results to provide a further diagnostic opinion. The diagnostic inferences become nested:

The end result? A chain of multiple abstract black-boxes representing models accepting input data and providing an output.
So what do all of these models need in order to provider inferences?
Models, whether human or algorithms built using software, need information.
To make best use of that information we need, to paraphrase a well known commercial motto:
“to organise clinical information and make it universally accessible and useful”.
“The record becomes part of your practice”
In relation to the medical record:
“You’re a victim of it or a triumph because of it. The human mind simply cannot carry all the information without error so the record becomes part of your practice.”
Dr Larry Weed, Internal Medicine Grand Rounds, 1971
So how we structure and use our medical records, whether on paper or digitally, is critical in supporting good clinical care. So how do we use our records to come to a diagnosis?
Step one: look at raw information
Here we see a list of investigation results from an individual patient in a tabular view sorted by descending date:
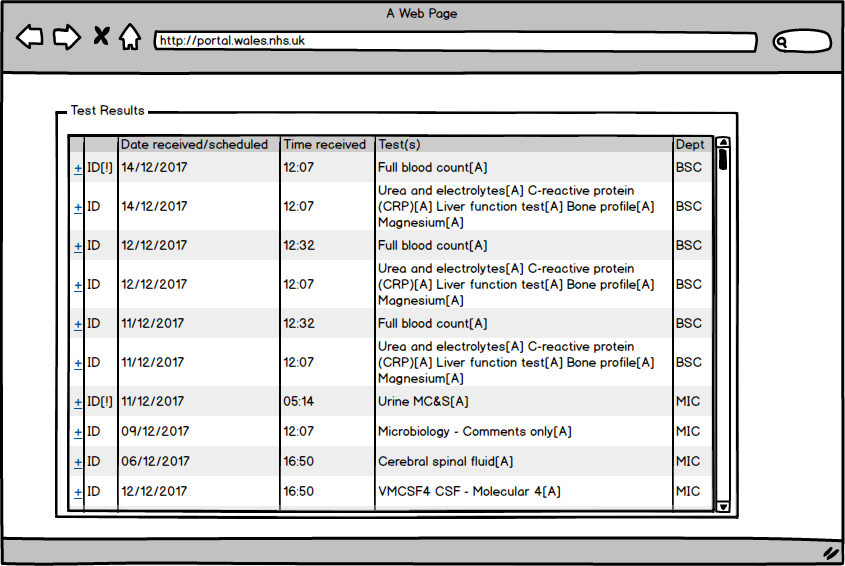
A view like this is seen in many different electronic health record systems and it is usable. As clinicians, we can click on one of the rows and see the result. Most systems allow the graphical display of various results over time permitting us to assess trends.
Likewise, we will have gathered additional raw information directly from the patient or carers about current and past symptoms, established previous medical problems such as chronic obstructive airways disease, an allergy to penicillin or previous cholecystectomy. In addition, we can corroborate and supplement that information from a review of the previous medical records. Such records may be on paper, in which case it is unlikely that they will be available in the emergency department, or electronic, either as a summary problem list or from piecing together information from multiple pieces of correspondence from multiple specialties.
Most health professionals will have sympathy with the analogy that we work as hunter-gatherers; our job is to find the right information at the right time and most of us will readily admit that this is usually time-consuming and error-prone.
For example, imagine a patient presents with drooping of the eyelids to their general practitioner, and that doctor checks for acetyl-choline receptor antibodies. This is an investigation that will take two weeks to be processed. Imagine the patient deteriorates after the test result is back but before it is seen by the general practitioner. Imagine then that the patient presents to the emergency unit, do you have confidence that your current clinical systems will make that result available to the admitting team or, even if it is available, that the team will specifically look for that test result?
As such, we have a problem: we must trawl through the medical record in order to manually organise information and make it useful. We take a problem with thousands of dimensions - our raw results - and reduce them to some high-level concepts.
Step two: summarise and synthesise
As such, to make sense of an excess of information in the medical record, most clinicians will attempt to create a summary to aid decision making. This is, in machine learning terms, a process of dimensionality reduction to identify the latent traits that are giving rise to the measurements that we can see. For example, one might write:
2-hours central chest pain
Sweating
Breathless
ECG: ST elevation anterior leads
Known: angina acute coronary syndrome 1997 -> stent in circumflex - angioplasty 1997 hypertension smoker
We conceive of the important information and apply that information to arrive at a clinical diagnosis.
Another example:
3-months of headache
subacute encephalopathy
deteriorating renal function
chronic lymphocytic meningitis
leptomeningeal enhancement on MRI brain
bilateral facial nerve palsies
For each, just as in Dr Larry Weed’s problem orientated medical records (POMR), we summarise at the most specific conceptual level that is defensible. If only a single lumbar puncture had been performed, we’d probably conceive of “lymphocytic meningitis” only, unless we could make an inference that the pathological process was chronic because of other factors, such as chronic headache and a long history of multiple cranial neuropathies. We might conclude chronicity based on repeated lumbar punctures or from synthesising the temporal pattern of clinical symptoms and signs over time. We populate our problem list based on the synthesis of multiple inferences from multiple sources.
For the first example, we have summarised the salient facts and have enough information to suggest “anterior myocardial infarction” as a most likely diagnosis. Indeed, we could use our anatomical knowledge to opine that the patient most likely has an occlusion in the left anterior descending coronary artery.
In the second example, we do not have sufficient information to arrive at a single most likely diagnosis, but we can arrive at a sensible differential diagnosis, a list of possible diagnoses such as “malignant meningitis”, “neurosarcoidosis” or “tuberculous meningitis”. The cause of the deteriorating renal function is unclear; we need more information to solve that problem.
We have defined the essence of the clinical scenario in order to help us make clinical decisions; we reduce the uncertainty about those decisions to a level which permits rational decision making. As I have previously quoted:
- We care about measurements because measurements inform uncertain decisions.
- For any decision or set of decisions, there are a large combination of things to measure and ways to measure them—but perfect certainty is rarely a realistic option.
- Therefore, we need a method to analyse options for reducing uncertainty about decisions.
Step three: iterate
Generating a differential diagnostic list is important; it allows us to consider the next steps of the diagnostic pathway: what questions to ask previously omitted and what tests to arrange. Such a methodology re-affirms the nested hierarchical nature of diagnostic inference and the importance of understanding a priori probabilities and the a posteriori probability after our measurement, test or indeed any other method of obtaining more information.
A test can only be interpreted in a wider clinical context. Acetyl-choline receptor antibodies, tested in a patient with a pattern of symptoms (what the patient says) and signs (what we find on examination) suggestive of myasthenia gravis, are highly, but not perfectly sensitive to a diagnosis of myasthenia gravis. As I have written before:
Similarly, if we have imperfect measurements that are not 100% sensitive or 100% specific, then we have to ask, sensitive and specific to what? Realising this provides an important insight: when applied, say to clinical diagnosis, is that almost all of our measurements in medicine are as if we are looking at the truth out of the corner of our eye. We cannot see the hidden truth but a combination of our measurements are, together, governed by a few simpler variables or concepts that are actually the cause of the results of the measurements that we can measure. As a result, we hope that our measurements can be used to understand the latent variable(s) that are actually the hidden cause of those measurements.
A latent variable is a variable that cannot be measured directly but we can infer its value from measurement of other observable measurements. In essence, we might conceptualise a latent trait as the real process to which our tests and assessments, combined together, provide an imperfect measurement.
Step four : reduce (dimensionality reduction)
As such, our highly complex, multi-dimensional medical record, combining symptoms, signs and investigation results, can potentially be simplified in terms of latent traits. Such a process is termed dimensionality reduction and humans perform this task implicitly to simplify both the process of decision making and the communication required around that decision-making between professionals and the patient.
For instance, a 72-year-old patient with a long history of smoking cigarettes and a prior myocardial infarction is likely to have atherosclerotic vascular disease. When that patient presents with new right sided arm and face weakness, we are likely to assume that their stroke has been caused by emboli from atherosclerosis rather than a dissection, even if both causes are possible. The same clinical event occurring in a 32-year-old patient during high-intensity exercise is likely to have had a stroke due to arterial dissection. Humans perform such inferences without necessarily being explicit in documenting their chain of inference; over years we build a set of heuristics, rough and ready rules of thumb, that mean we make reasonable conclusions.
Step five : avoid biases
Unfortunately, humans are subject to a range of cognitive biases (see “Thinking fast and slow” by Prof. Daniel Kahneman) which results in a failure of our heuristics. For example, in confirmation bias, we may place greater emphasis on new information if it confirms a pre-existing belief or conclusion.
.png)
As such, the structure of our medical records, whether on paper or electronic, can inadvertently exaggerate our own biases. Conversely, properly organised and well structured records may help us to spot our biases and support their avoidance.
For instance, it is easy to fall into the trap of “anchoring”, in which the first piece of information acquired skews all subsequent inference as it is prioritised ahead of subsequent information.
Computer-assisted care
Information technology can and should valuably support caring for patients. Unfortunately, healthcare has not adopted information technology as quickly or effectively as other industries. For others, information technology is now the way that those businesses operate. Healthcare could immediately benefit from better scheduling, planning and communication using off-the-shelf technologies widely used in other domains. In addition, we should be adopting other technologies as soon as possible : identity management, delegation and consent, evaluating privacy-enhancing technologies (PETs) with focus on re-imagining our services around patients and enabling that transformation with technology.
However, in this essay, I want to focus on discussing computer-aided decision support and the value of applying machine learning in supporting the care of patients. With the right tools, we could do much to:
- support presenting the right information at the right time
- suggest “measurements” (to obtain new information such as symptoms, signs or investigation results) that will add valuably to the decision-making process
- suggest differential diagnoses or treatment plans
- take steps to avoid common human cognitive biases
Machine learning and healthcare
The reason that machine learning has been used so effectively for image interpretation was the creation of large amounts of training data. Training data, for machine learning, needs to provide the input parameters and the labelled expected output. For an image, you might have a human label an image of a cat as a “cat” and then, together with hundreds of thousands of other images, a machine learning model can be trained and tested. There are now many publicly available training datasets available from multiple sources.
So how can we achieve superhuman performance for clinical decision making?
We need to start thinking now about how to structure medical information so that it is possible to create large-scale publicly available training datasets and to understand how to transform clinical data from electronic patient records into the same format to permit testing and application in real-life clinical scenarios.
In short, we need a “open computable medical record”, the OCMR.
Open Computable Medical Record (OCMR)
The OCMR is a simple intermediary data structure that can be used to be build datasets representing clinical knowledge. Initially for version 1, its focus is on diagnostic inference, mapping a combination of clinical findings to a most likely diagnosis. We use SNOMED-CT, an international terminology to represent the concepts in our clinical knowledge model; they are the primitives around which we build our knowledge.
For example, the simplest structure might be:
[acute kidney injury:14669001] + [naproxen:11847009] = [Analgesic nephropathy:59400006]
Each link will take you to the NHS digital SNOMED CT browser.
Why should we use SNOMED CT?
SNOMED CT is a human-curated ontology tracking clinical and non-clinical concepts and the relationships between them. For instance, SNOMED CT will tell you that [acute kidney injury] is a type of [kidney disease:90708001].
My own SNOMED CT REST API provides this information in a computationally-useful manner : acute kidney injury and naproxen.
What this means is that an algorithm can potentially learn generic knowledge from specific examples.
It is conceivable that a model, knowing that naproxen can cause acute kidney injury, can also learn that the broad class of analgesics can cause acute kidney injury and so, when faced with a patient on ibuprofen, can suggest a correct judgement.
While SNOMED CT contains many types of relationships permitting us to infer that “acute kidney injury” is a type of kidney disease, it does not contain any data providing support for diagnostic inference. As such, we need to embed SNOMED CT concepts within a wider OCMR information model in order to express potential diagnostic inferential relationships.
It is not difficult to conceptualise the OCMR as a 2-dimensional image with each pixel representing a clinical finding:

Here, the source “image”, a set of factors representing “chest pain”, “shortness of breath” and “ECG ST elevation” are analysed and the most likely diagnosis given: “acute MI” (myocardial infarction).
It is not difficult to envisage making an OCMR more structured and more refined to provide additional contextual information relating to clinical context, baseline characteristics of the patient such as age and sex as well as the severity and nature of each clinical finding; we might categorise these as acute, sub-acute, chronic or episodic for example.
I have included an example OCMR record for a diagnosis of myocardial infarction. It is available as a JSON-formatted file including the clinical problems (and for each the higher-order more generic concepts) and the final diagnosis. The example file is available here. I would envisage converting this to a flat vector for ease of processing.
Meta-learning and dimensionality reduction
The rationale behind defining an OCMR is to provide machine learning models with a set of deep underlying (latent) traits that act as as the core principles supporting diagnostic inference, just as used by humans.
We do not simply want a model that, given free text, outputs possible diagnoses, even though that might be an eventual result. Instead we want models that support building a more thorough foundation for clinical inference, that might even allow us, with the right right tools, to identify and understand inferential relationships and latent traits that we currently do not recognise.
For example, we might use the models to take new input from a patient’s medical record and support their direct care. In a patient with chest pain, a trained algorithm should be able to make diagnostic inferences and suggest information that is required such as “we need an ECG for this patient presenting with chest pain”. The model has learnt the relationship between chest pain and an ECG and even troponin results; with the right integration of decision support into our electronic health records, the algorithm could help us by highlighting the important information rather than simply showing all results in chronological order.
Sources of training data
How can we build a corpus of medical knowledge containing diagnostic inferential relationships as well as codifying choice of next diagnostic steps, interventions and treatments?
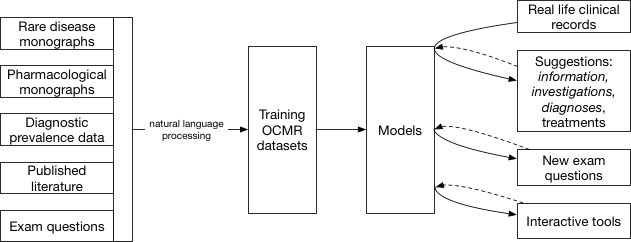
I would argue that we need to consider multiple sources of medical knowledge and make them usable by converting them into the OCMR format; the OCMR data model is essentially an intermediary data structure for medical information in the same way as images can be represented as a bitmap image file and readily analysed.
The potential sources of information are:
- core epidemiological data - providing information on incidence and prevalence for a range of disease
- free-text monographs about diseases, such as those from rare disease databases
- free-text monographs about drugs
- textbooks
- exam questions
Epidemiological data
Epidemiological data relating to the incidence and prevalence of different diseases are usually well-described in the literature. Such data can provide important a priori probabilities of different diagnoses in different clinical contexts.
Such data could be supplemented by real-life data taken from known patients - for example, the GP research database (GPRD) or hospital episode statistics (HES) for hospital admission and discharges. Such data will be recorded either as Read codes or ICD-10, but these are readily convertible to SNOMED-CT and could contribute to an publicly-accessible OCMR.
Free-text monographs, literature and textbooks
For many rare diseases, there are excellent semi-structured and authoritative descriptions of clinical features and types of presentation. It is not difficult to see how natural language processing could be used to extract the important phenotypic features of a range of rare diseases in order to support the identification of patients usually only possible by specialists.
For example, the OMIM (Online Mendelian Inheritance in Man) resource on DRPLA, a rare neurodegenerative disorder is detailed and includes the important symptoms and signs. OMIM make their dataset available on the Internet in both human-readable and machine-readable formats.
Similarly, adverse-effects of different pharmaceutical compounds could be imputed from monographs in standard pharmacopeiae and so potentially highlight to non-specialists where a drug might be contributing to a patient’s problems.
Exam questions
We have been building up large numbers of semi-structured questions in medical schools across the UK and have a collaborative national question bank run by the Medical Schools Council Assessment Alliance (MSC-AA). We also have similar banks of questions for the postgraduate examinations managed by our Royal Colleges.
Could these question banks be useful as a corpus of knowledge for machine learning?
In my prior role in the School of Medicine at Cardiff University, we used to encourage students to use assessments to drive their learning by sitting as many exam questions as possible. As part of that work, we implemented a “progress test” in which students sat 3-4 exams per year with detailed feedback to identify areas for which they needed more help. We now have thousands of questions in our bank alone.
Can questions drive learning for machines?
For example, this is from the USMLE
A 52-year- old woman comes to the physician because of a 1-month history of headache, weakness, tingling of her extremities, muscle cramping, and fatigue. Her blood pressure is 170/110 mm Hg. Physical examination shows no other abnormalities. Laboratory studies show a decreased serum potassium concentration, metabolic alkalosis, and decreased plasma renin activity; serum sodium concentration is within the reference range. Urine catecholamine concentrations are within the reference range.
Which of the following is the most likely diagnosis? A. Adrenal adenoma B. Focal segmental glomerulosclerosis C. Hypothalamic tumor D. Juxtaglomerular cell tumor E. Renal artery stenosis
Answer : A
The important characteristics of exam questions are:
- they are a succinct distillation of important clinical concepts with a labelled answer; they usually do not contain extraneous information
- they contain sufficient information information to identify a single best answer
- there is a single best answer, although the distractors should be reasonable to someone who doesn’t know the answer
- they are semi-structured - with a stem (the clinical scenario), a lead-in (the question), the possible answers and the correct keyed answer.
- medical schools and colleges should write questions on the most important and common clinical scenarios; they should represent a representative corpus of medical knowledge
The potential problems with exam questions are:
- is it possible to obtain sufficient questions in order to contribute to the learning of a model?
- is it possible to use natural language processing to extract the terms from the lead-in and to map the possible answers into a structured format suitable for our OCMR?
If these issues can be overcome, then the SNOMED-CT ontology tells us “headache” is a type of “pain” in the “head” so that any learning system can learn on the broad generic concepts and not only the concept used at the time.
For example, we can map each entity within that free text to a SNOMED-CT concept. Here I use my relatively rudimentary free-text mapping service:
Plasma renin activity maps to to 8883510000001 or in JSON: http://msdata.org.uk:8080/snomedct/concepts/888351000000102/recursiveP arents which tells us we’re measuring “renin”…
Similarly, we match on “headache” and understand that this is a type of “pain”…. in the “head”…
And the right answer is (A)… Adrenal adenoma, so, we can look that up too…
http://msdata.org.uk:8080/snomedct/search?s=adrenal adenoma http://msdata.org.uk:8080/snomedct/concepts/255036008/recursiveParents
and then understand that this is a type of benign neoplasm of the adrenal gland.
As such, for any single question, it might be possible to impute a range of different data based on more generic high-level broad concepts. Likewise, if there is insufficient training data for creating a high-dimensional map at a high level of granularity, we can use techniques to reduce dimensionality and create a low-dimensional model. Indeed, it is likely that identifying the core principles and trends from high-dimensional datasets will permit better predictive models to be created.
For example, this question not only links a diagnosis of adrenal adenoma with fatigue, hypertension, a low serum potassium concentration and metabolic alkalosis, but it is conceivable that the training data could be used to identify patients with similar symptoms and signs and suggest that renal profile should be checked.
Likewise, the resultant model may be able to generate additional questions for subsequent training, by humans and algorithms alike.
Conclusions
Information technology has the potential to revolutionise healthcare and augment our clinical decisions by helping us understand patient information in ways to directly improve care. Clinical decision making is complex and we need to consider ways to both understand and support our decision-making. We don’t want to abdicate responsibility for decision-making; indeed, decision-making is a partnership between professional and patient. However, for too long, human professionals have had to spend time gathering the right information instead of focussing on where our skills are needed most : high-level thinking and communication. We should be working towards building tools that support us in the care of our patients.
I have started work on the first version of the OCMR and I am going to try to build some publicly-available datasets to kickstart the application of machine learning in healthcare. As an experiment, I have built a fake dataset generator (go-snomed) which builds a fake OCMR JSON structure to try to understand the pitfalls of this approach.
I think the next steps are:
- Build natural language processing tools to extract clinical terms from different sources of clinical knowledge such as monographs and questions from exam banks.
- Work with universities and colleges to obtain questions for machine learning. In the interim, generate fake questions for testing.
- Generate dimensionality reduction techniques to genericise highly granular concepts and their relationships identifying the broad underlying principles at play.
- Work on collecting incidence and prevalence data from a variety of different clinical contexts.
I would love to hear from you if you would like to be involved or indeed, help support this work.
Mark