Getting health and care data back to front
In most health and care economies, it’s really important to be able to feed back data in order to inform and assess policy as part of central reporting.
I’ve written previously about health and care central reporting requirements, and that such data returns are helpful and important but must be regarded as simply one ‘prism’ through which to ‘see’ a patient record.
It’s good to see a specific example, so have a look at the NHS Wales breast cancer reporting requirements.
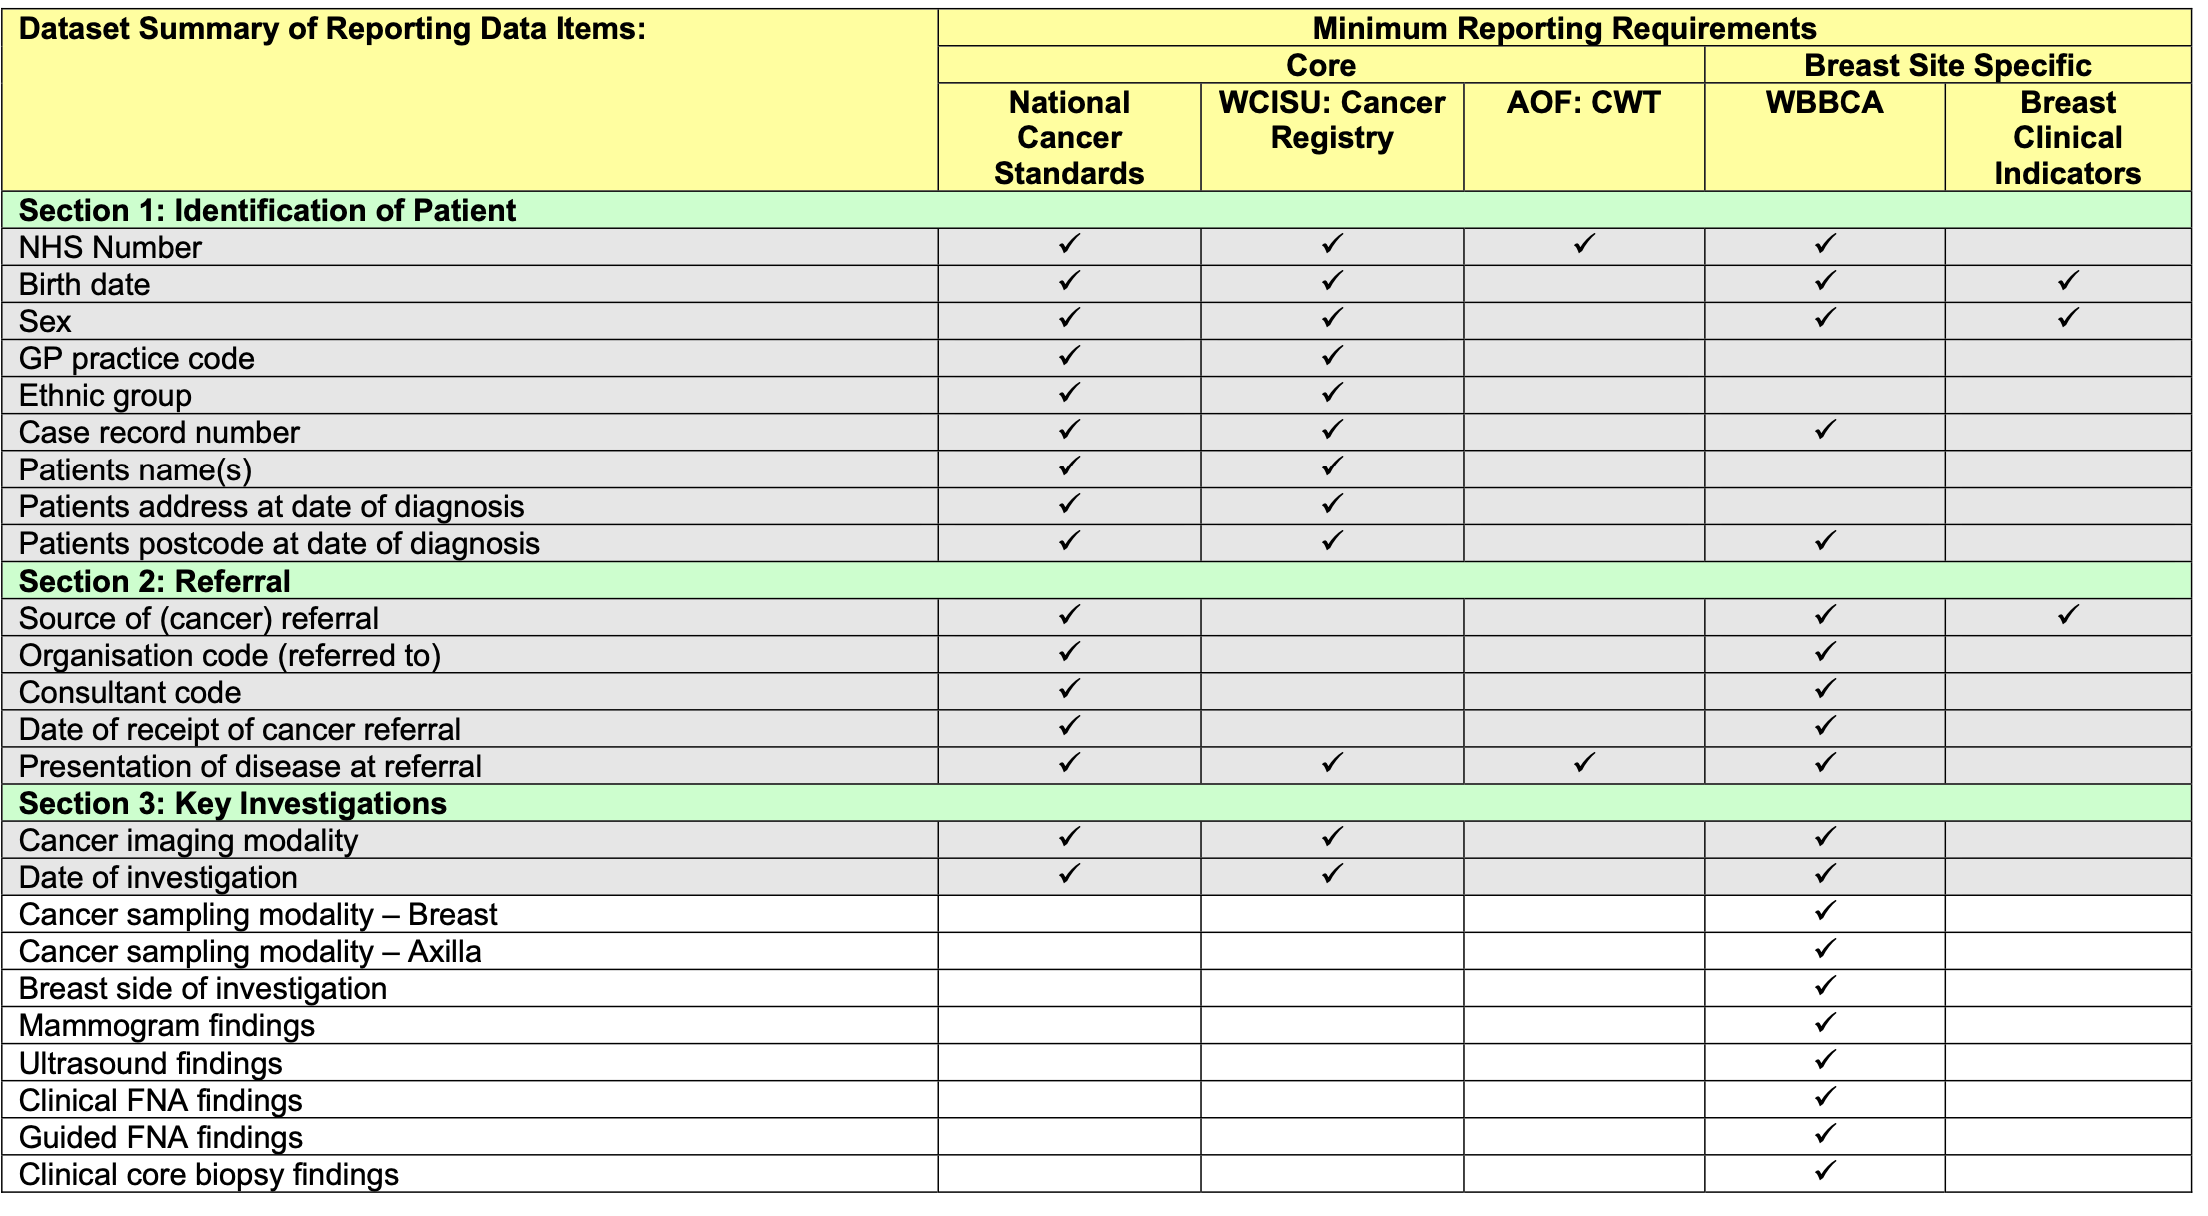
This dataset is a summary of the important aspects of breast cancer care and is vital for planning and improving services. It should also be used to inform operational data collection.
However, it’s important that those requirements don’t dictate how that collection should be made.
That link reflects version 4.1 of the reporting requirements; requirements change and any digital systems supporting those reporting requirements needs to be able to adapt and flex accordingly.
Rectangles and projections
But can we use central reporting requirements to design our clinical information systems?
Many central data reporting requirements want data to be representing in rectangles. That’s a bit like looking at patient data through the prism of a spreadsheet, such as Microsoft Excel.
This is not dissimilar to cartography where a map projection takes the richness, splendour and complexity of a globe’s surface and projects it onto a two-dimensional surface for your atlas. In cartography, multiple projections are available that suit different purposes, each compromising the original information in some way. Each of those representations also create their own value - a two-dimensional map can be printed or shown on your flat screen - they are useful representations, but they’re not the truth.
Knowing how our health and care data will be used by policy-makers is critical in designing compelling clinical information systems, but we need operational, day-to-day clinical data to solve multiple purposes - direct care, management / policy and research.
Data-entry; we’ve got things backwards!
Unfortunately, to meet the demands of central data reporting, it is commonly the case, even in 2020, that data-entry, whether for cancer or for conditions such as stroke, is done after-the-event by someone whose job it is to collect the data and complete the returns. It’s retrospective, labour-intensive and error prone. It’s often the same for research; a separate methodology rather than a difference of acuity.
Sadly, the data is not entered as a function of the process of care.
But it should be clear from the reporting requirements that most of the required information can and should actually be sourced from operational systems, if only one could build adaptable systems that prioritise meaningful data and can be stitched together and used as a source of meaningful information from which the right information can be plucked in order to make decisions.
So how can we make data a function of the process of care?
Funnels: the opportunity of decision-points
For example, the multi-disciplinary team (MDT) meeting is an opportunity for the aggregation, validation and input of decision-critical information. It’s easy to see the MDT as a funnel, and this doesn’t only apply to cancer, but any complex decision making such as epilepsy surgery or neurovascular disease in which multiple facets of information need to be understood by a multi-disciplinary team.
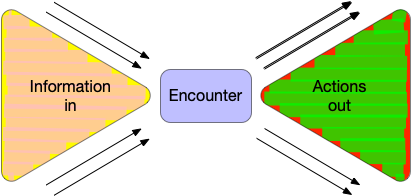
Indeed, the MDT is a microcosm of all clinical encounters, even when there’s only one professional involved. The funnel model is applicable to all clinical encounters.
Each clinical encounter is an opportunity to bring together disparate information, synthesise, formulate and plan. We need to not only capture that process but build technology that can make it as effective as possible. That means supporting both ends of the funnel - making the right information at the right time and supporting clinical synthesis and the ongoing orchestration and coordination of clinical care.
On data and decisions
The problem with data in health and care is that there is no such thing as a single source of truth.
This manifests even for what might be perceived as simple such as a patient’s address. Is that address the address for correspondence, the address of the parent, the term-time address or the address from which the patient moved from last year?
It’s even more difficult for clinical data. Terms such as ‘diagnosis’ might not sound difficult but are fundamentally defined by context. A diagnosis of angina made by me is very different to that made by a cardiologist! Even our diagnostic tests are imperfect measures of the ‘truth’ with false positives and false negatives and repeated tests that give different results.
Even the diagnostic process isn’t what might be imagined. We don’t record what we find and then work out the most likely diagnosis. We do it in reverse! The diagnosis informs what information we collect and how we examine! It’s iterative and internally correlated.
Even prescribing information is imperfect. Did the patient actually take that drug at all? Sometimes not at all.
And look at how much information we might have. Is that step-count data, or home blood pressure monitoring data useful for informing our decisions? What tools do we have to make sense of burgeoning information from multiple sources? We can be overwhelmed with too much information.
It’s much better to see clinical data for what it is and use it appropriately - we’re looking at the truth through the corner of our eyes, our data an imperfect imprint of the truth. We’re creating models.
Ultimately, there’s uncertainty surrounding all of our decisions, and our data can help to reduce that uncertainty. Usually that’s by bringing different sources of information together.
Information at the right time
So we need software and systems driven by data.
That means a digital health and care patient record is much more that a flat list of documents with little or no accurate metadata.
But we shouldn’t ignore documents either. They have some important positive characteristics:
- They can and should carry their own context; they can (usually) be read standalone
- They reflect a snapshot of ‘state’ and thinking at a time-point
- They are immutable, so don’t change after the event - if a change is needed a new document should be issued.
- They support processes of care - because while they also a type of record, they move around and so can be used to activate different workflows.
The fact that documents move around is really important. They are a driver of much tacit process and workflow. We have many unstated assumptions in health and care and one of our jobs is to understand their existence and their importance.
It’s better to see documents are the artefacts of care. Just like data for central reporting, we have things back to front and should be generating our documents and cascading workflow from our processes of care, and not the other way around.
The medical record isn’t a simple record of what happened but a tool that helps us formulate, plan, communicate and deliver care. It’s a tool. “You’re a victim of it or a triumph because of it. The human mind simply cannot carry all the information without error so the record becomes part of your practice” (Larry Weed, 1971 - see https://wardle.org/cis-design/2017/05/01/medical-record.html)
Effective software development
The breast cancer data collection requirements potentially teach us a lot; the essence of those requirements has broad applicability to other diseases, whether cancer or not.
It’s so important to have a strong vision for how we want the future to look, and how we want to enable data to drive patient care, service improvement and research, but there’s a paradox in technology, in that the best way to deliver technology is to break apart the big problems that you’re trying to solve and then compose the solutions together again. We have to think big but work small and iterate.
Composability is fundamental to the next generation of electronic health and record systems.
And we also need to be sufficiently confident in our understanding of technology that we call out the hubris when someone provides an 18-month plan for how to deliver intangible benefits. We have to be able to stand up and say that this bit is a hard problem and we’ll need to explore different ways of solving that, and understand that we will fail.
Paradoxically, working incrementally in the small is less risky than following an 18-month plan. Planning is good, but our plans will change and adapt as we learn.
It’s seductive to think otherwise, and pretty difficult to sell “we don’t know” as a tagline. Perhaps you don’t get appointed to a job if you say we “don’t have all of the answers”.
Of course, there’s a lot we do know, and one size doesn’t fit all in technology, whether we’re talking about approach, standards, ‘buy vs build’ (should we buy the solution to this problem off the shelf or build it ourselves?) or any other facet of ‘digital’, and so we need to see the fracture lines and break-apart our problem domain and get on with delivering appropriate solutions or starting the graft of learning how to solve problems in that domain.
We need to be agile.
Deliver better and faster by doing things right
We can speed up delivery of valuable digital tools and technology by adopting the right approach. We should stack the odds of being successful in our favour. There are many examples where will fail to do this.
So let’s return to breast cancer. What can we learn from this?
- Central reporting helps us understand what is important from policy-makers.
- Data should be sourced from results of the processes of care.
- Operational systems should focus on meaningful data
- We need to adopt a modular, de-coupled and agile approach to health and care software and data.
It’s not difficult to see the sources of information that we need for breast cancer reporting - demographic data links a patient with different identifiers across organisations, appointments and scheduling provides a virtual scaffold for the ‘when’ and ‘how’ things have happened via different pathways, laboratory and radiology data brought together help understand the pathology and its extent (staging), and finally, at MDT, we need tools to validate and refine those ‘inputs’, record the decision-making and plan the next steps in care.
In fact, those requirements for breast cancer are not much different for any other illness either.
And that tells us what we need to be building for the next generation of electronic health and care record systems.
And how can we deliver a compelling and credible plan to build that technology that will underpin our ambitions for health and care in Wales?
National governance arrangements and technical architecture need to ensure that we reduce the need for constant coordination between different groups.
We’ve failed if we need everyone ‘in the room’!
We need to instead:
- decouple and modularise, to permit parallel independent working at pace
- use open technical standards to define the interfaces between modules
- avoid single repositories and instead use shared vocabularies
- develop an unremitting focus on data.
- foster greater use of off-the-shelf cloud providers and move to abstract our infrastructure
- define clear lines of responsibility for different services, and include performance and reliability metrics.
Mark